People ask me all the time why I got off the corporate TA executive leadership track to join ERE Media. Did they fire you Rob? Did you get bored?
Quite simply it was one particular thing.
When Ron Mester the CEO and David Manaster, the founder/owner of ERE Media, called me out of the blue over a year ago they did something that no one ever asked me before, not in a formal job type of opportunity way. They asked if I wanted to help change the recruitment industry. Most of us who have been in recruiting for a while would of course answer yes to this question; heck, our profession needs some changing.
The more we talked about what changing the recruiting profession looks like, two common themes came up on what could impact that change quicker than other things.
- Recruiters turning up differently, becoming more strategic, proactive, and consultative. Becoming a talent advisor to support the business vs a reactionary and transactional recruiter. Note: I am going to write an article about this in the near future about the progress we have made on this front.
- Recruiters and TA leaders becoming more data centric in their thinking and using data to tell stories to help influence and enable change.
Back in September last year I wrote an article showing the recruiting profession the journey I was on in my role as Chief Analyst at ERE: A Standard Set of Recruiting Metrics. Thank you to those of you that read and pledged your support and help with this. What I am going to show you next with a game-changing benchmarking solution could not have been achieved without you!
For the last year I have been locked away in my basement working with some very smart people on some very complex challenges and I am very proud to announce that we now have a solution that helps recruiters and TA executives use data to help influence that change:
A free and subscription-based recruiting benchmarking solution using real data out of companies’ applicant tracking systems. I will get to the free stuff in a minute. 🙂
Before I go on though, I want to be totally transparent that this was a hard article to write. While yes this is in part infomercial on a product that ERE built in partnership with a company called Brightfield Strategies, it’s also an article that covers what lessons I have learned along the way about companies ‘ATS data and how traditional opinion-driven benchmarking has to change.
“The broader and deeper the data, the more types of questions the benchmarking tool can answer. It’s a never-ending quest to acquire more data, there’s always going to be another layer of detail we successively seek. — Jason Ezratty, President Brightfield Strategies
Just as it was important to get the feedback of the customer (people like you) ad not to build a solution in a vacuum, I also have shown a handful of people that I respect and trust in our profession behind the curtains of the product. You will see a few quotes from people throughout this article as building something our industry finds of value needs an analysts point of view as well.
Finally, if you have not read my articles in the past, I suggest you grab a drink (your pick depending on time of day), sit back and relax, as I like to give lots of details.
Let me ground you in historical recruitment-benchmarking practices first for context.
I know some of you will relate to this story as it’s happened to you as well. Some of you reading this story, if it has not happened to you yet, there is a good chance it will in the future.
Many years ago a senior business executive leaned on a CHRO with the statement: “I think our recruiting function sort of sucks as it takes way too long to hire people and it costs way too much money.”
Off the CHRO went and engaged a well-known professional services organization to come in and benchmark how our recruiting function compared to the industry. The way this professional services organization approach this project (like they have done many times before) was to come in and interview myself, HR, and business leaders. They asked page after page of questions, asked us to fill out a big survey document, and also asked us for our recruiting reports to determine Cost per Hire, Time to Fill, etc, etc.
Fast-forward $80,000+ dollars later, and they came back with a report on how our performance benchmarked and stacked up against others. While the report looked good at first glance, as I started to ask questions. The following is what ensued in that conversation.
I started off by looking at Time to Fill and being the inquisitive person that I am (some have referred to me as a pain in the ass with all the questions I ask), I started to ask the following questions:
[Me] “I see that you are saying our average Time to Fill is x, did you factor in the following?” ….
“The Req Approval process of companies, as I know that some companies might open a Req up in the ATS but can’t officially start recruiting on it until it is approved by business leadership. Did you factor that into your calculations”?
[Consultant] “No, we don’t look at that”
[Me] “I see that this is a rolled up aggregate number, can you tell me how we stack up against these particular revenue-generating roles, given these are critical roles to our business”?
[Consultant] “No, as we can’t differentiate, as it’s an aggregation of all roles and job families.”
[Me] “Did you exclude evergreen or pipeline reqs where the hiring manager says, “just post the role and keep it open until the perfect candidate comes along,” as I know that some of those reqs can take 365+ days to fill and if included, they skew the averages big time”?
[Consultant] “Errrr, No.”
[Me] “Can you show me the data and performance on TA structures that are centralized vs. decentralized vs. internal sourcing team vs. leveraging offshore or near-shore support. I want to make sure we are comparing apples to apples where possible”?
[Consultant] “Errrr, No.”
This went on for another 15 minutes on other related topics of recruiter workload, and metrics that I tracked like Recruiting vs. Business Consideration (RVB) that they never benchmark against. RVB is my favorite metric and I sill show you why below. Note: I use it as a stick (or a carrot) to hit the business with. 🙂
One final question I that I asked was I thought the most telling.
[Me] “I’m all about continuous improvement but I am not clear when I see these numbers in total aggregation: where are the specific job families or cities or job levels where we are in top quartile performance vs. bottom quartile performance? It’s very hard for me to know where something is broken or gain actionable insights when I have no way of understanding where within the aggregation of a metric we might be over or under performing”?
[Consultant] “I’m sorry but we can’t get to that granularity of similar comparisons with other companies as their operational processes and ATS workflows are all so different”
So Here We Are Today … The Next Generation of Recruiting Benchmarking
Based off that previous experience one of the first things I did when I joined ERE was I picked up the phone and called lots and lots of TA leaders smarter than me who understand the power of what proper benchmarking could be. Thank you to all (you know you are) who were the foundation of what now exists today as a real product.
If you know who ERE is as a company, then you will also know that we are not a traditional software company. I had a comprehensive idea about what a benchmarking tool needs to look like and the value that needed to be derived from the insights based off my personal experience and the input of those TA leaders, but we needed an experienced partner. We were lucky enough to partner with a great organization called Brightfield Strategies who have been providing benchmarking and deep analytical insights to the fortune 100 on contingent labor data.
“Benchmarks are what high performers stand on when reaching for world-class.” —Gerry Crispin, Principal & Co-Founder, CareerXroads
Let me show you a few screen shots of the Benchmarking tool and I will explain in more detail below of why this is so different to traditional benchmarking.
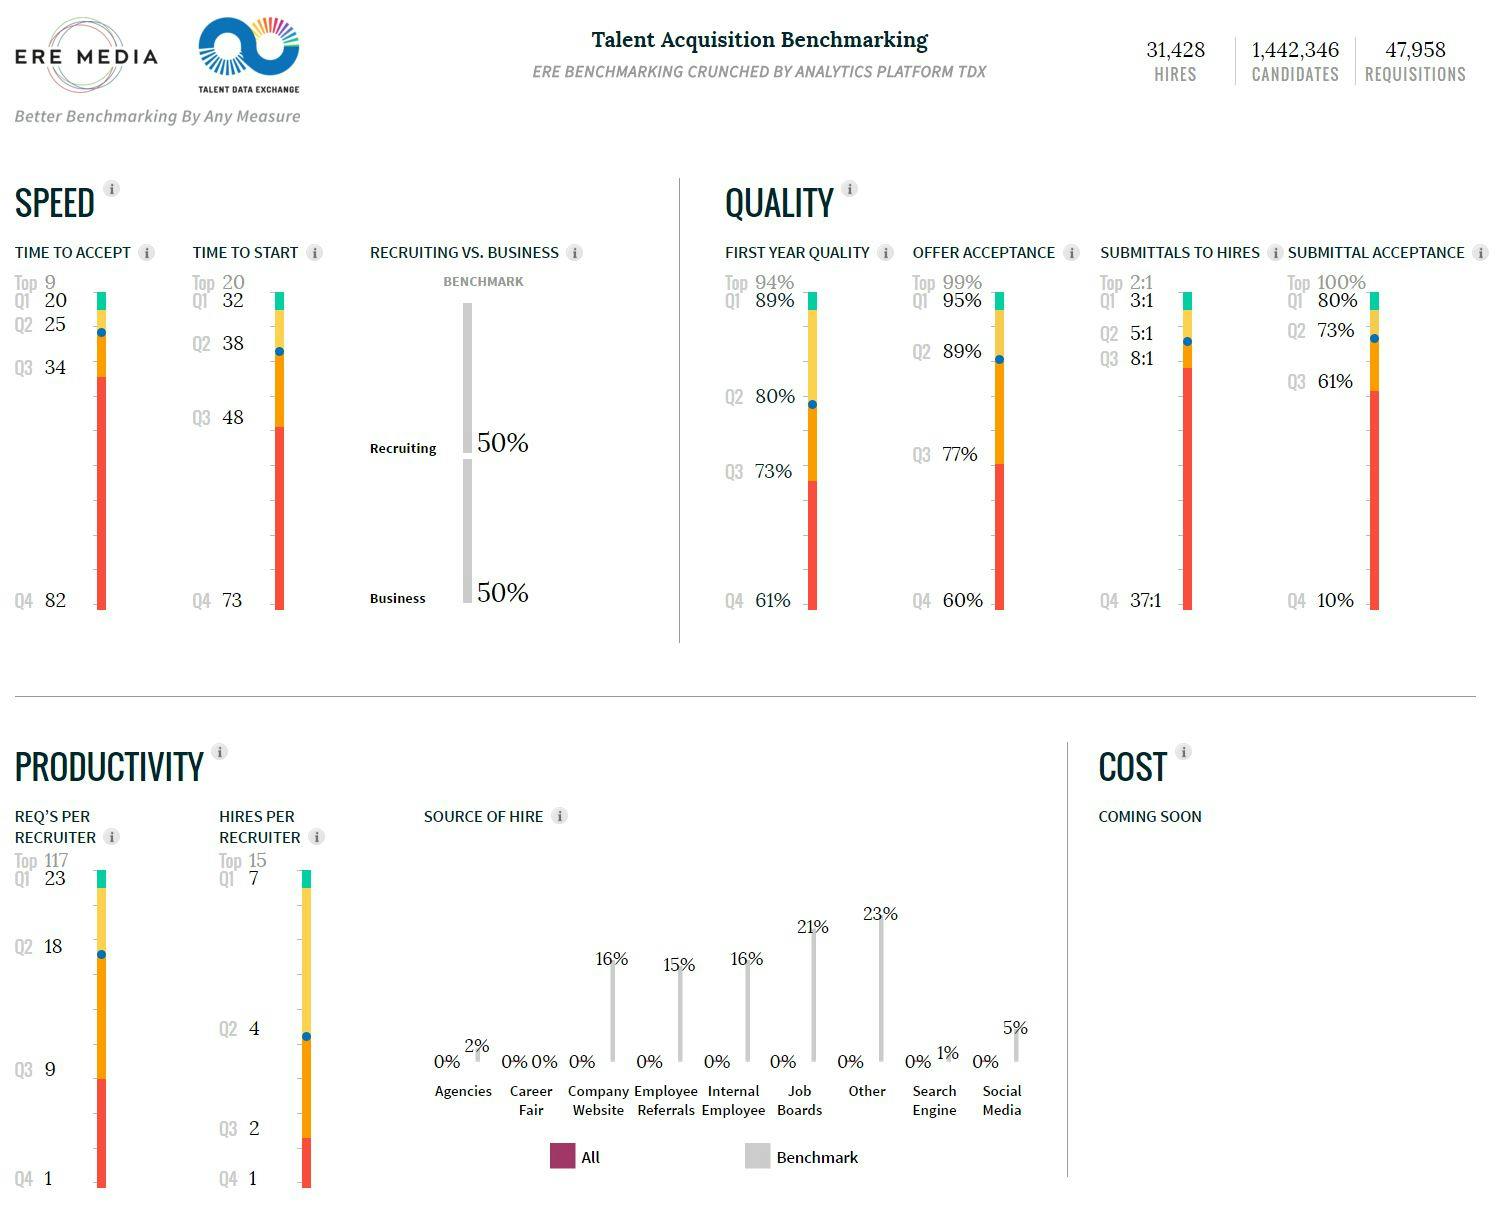
The Dashboard
This is the main dashboard that a user sees when they log into the benchmarking tool. Currently there are three sections of Speed, Quality, and Productivity metrics x 10 metrics. Most importantly, using a company’s ATS data they can see their own performance against four quartiles of comparative benchmarking for each for these metrics.

For the last nine months we have been partnering with lots of organizations, not asking them to fill out a 42-page survey document, but getting their data out of their own ATS. No personally identifiable information, all anonymous, confidential, and most importantly, we have some heavy duty process governance and technical rules in place that map to a standard set of metric formulas.
Data Integrity Is the Foundational Key
“When the majority of recruiting activity occurs outside of a core system of record, critical elements of business intelligence (e.g. efficiency metrics, talent pipelining, sourcing channel performance) are tracked within each individual tool. Pulling reports and monitoring key performance indicators becomes an arduous process. Data integrity may be compromised from one platform to the next, and manually mapping activity and outcomes across various systems provides limited insight — and weak business intelligence. — Kyle Lagunas, Principal Analyst, Lighthouse Research & Advisory
I hope you all understand why the first step in this journey was to get input on a standard set of recruiting metrics and their formulas that I talked about in my previous article above. We don’t change the way you use your ATS or reports. We just map your existing data to a standard set of recruiting metric formulas. The heavy lift on mapping and validating the data is on us, not you.
If we did not do this first, then you would be stuck like historical benchmarking of potentially comparing apples and bananas with no actionable insight.
Most importantly for benchmarking to work properly, the integrity of the data we receive and use is critical. To give you real-life context here: As of today as I type this article we have over 1.3 millon candidate record data points. But, we have also thrown out over 1.5 million records that were not usable because of either the way a company configured its ATS, limitations of the ATS technology, or operational and process challenges with the way the recruiters use the ATS. In short we have dozens of governance processes, technical rules, and algorithms in place to omit the crap data. This alone has taken us months to validate and we continue to make the integrity of data a primary cornerstone of the solution.
In full transparency we have some customers where we cannot benchmark them against all 10 metrics because of either their ATS or operational challenges. I have even had to tell some potential customers we cannot help them currently, but here is a list of things you need to do to clean up your own house first.
Let me give you a tactical and practical application of this. Time-based metrics are some of the most complex to benchmark against because of the hundreds of different ATS workflow configurations, but also because companies have different internal policies and operational governance around how to calculate Time to Accept.

Benchmark Formula for Time to Accept (TTA): The clock starts on the metric calculation the moment the requisition (job order) is approved by the business, and the clock stops on the metric calculation the moment the candidate accepts the job offer (verbal or written).
As part of the onboarding process we go through with companies, we ask dozens of questions that help not only correctly map them to a standard measurement for each metric, but also helps us uncover these variations in internal operational policies.
If you have worked for a few different companies in your career, you already know that some companies build the req approval process into their ATS workflow as a step/status, and others do it offline so the req create date is not always the same as the req approval date. In the TTA example, we want to know if you have a req approval process where the business has to sign off on the req before you can start recruiting. If we did not understand or ask these questions, then we could end up assuming that the clock starts on speed-based metrics once the req is created in the ATS. That would be a big oversight and wrong. This is one practical example of dozens of situations that can impact the integrity of a standard metric.
Being personally responsible for managing a recruiting function, deploying multiple ATSs/CRMs over my career, and getting insights from other TA leaders has been extremely valuable in knowing where the potential landmines are when it comes to HR tech data. Integrity of data goes way beyond the tech and extends itself in people and process way more than you might realize.
As an interesting side note is that seeing so many different companies’ data from so many different ATSs out there in the last year, we now know that when a potential customer says the ATS they are currently using, we immediately smile or cringe. Let’s just say not all ATSs are created equal and some are just downright nasty. 🙁
So Why I Think This Benchmarking Solution Is So Sexy!
“The ability to benchmark performance in addition to having solid internal performance data is going to be the next frontier in Talent Acquisition. — Tom Becker, CEO/Founder, Talennium
As in my story above, the area that I outlined in my questions to the consultant — the one about being able to cut, filter, or pivot on the data beyond a broad rolled up average –true benchmarking is not only comparing yourself to your competitors, but more importantly the ability to analyze and drill down into the data to gain useful insights.
So based off all TA leader conversations, we wanted to ensure that all Speed, Quality, and Productivity metrics could be filtered and compared by multiple combinations as to provide specific over- and under-performance insights. You want to know if you are in top quartile performance for certain job families, in specific locations, so you can replicate that elsewhere. Or you’re in bottom quartile performance so you can focus on the problem and improve, right?
As we all know the Time to Accept on a senior business development sales role in New York City will potentially differ than the exact same role in Dallas. Or there are differences in a junior role vs. a senior role. Or comparing yourself to a competitor who leverages an RPO and you don’t. Or seeing the deference in benchmarked performance on req load for some of your recruiters who look to fill different req types and job families than your other recruiters. Not all roles are created equal.
By having these multiple filters allows you to gain the real insights beyond all these variables being rolled up under one big average.
10 x Recruiting Metrics x 17 Detailed Filters
The current benchmarking filters to slice the metrics beyond the averages today cover:
- By Industry (Healthcare vs. Retail. vs Manufacturing. vs IT, etc.)
- By multiple Job Families and Job Titles (Over 200 and growing)
- By Geography (Country vs. City vs. State)
- By Job Levels (Entry vs. Senior Individual Contributor vs. Manager, etc)
- By Number of Employees (Similar company sizes)
- By Number of Hires Per Year (Similar volumes of hiring)
- By Recruiting and Sourcing Models (Centralized vs. Decentralized vs. Internal Sourcing Team vs. Use of an RPO, etc)
- By Time (Month vs. Quarter vs Year)
To give you an example of this, here is the Recruiter vs Business (RVB) metric visual that I referenced above.
This example out of the benchmarking tool is of a specific high-tech company hiring sales roles where the recruiting team does a great job of finding the candidates quickly but the business takes significantly longer to pull the trigger to make a hiring decision vs the industry benchmark.

Benchmark Formula for Recruiting vs Business (RvB): How many business days the recruiting function takes to identify, screen, and submit the candidate vs. how many business days the business takes to interview and hire the candidate.
All TA leaders love this particular metric, as it shows where it’s not a recruiting problem as you are finding, screening, and submitting candidates quickly, but rather it is a business problem because hiring managers are either taking too long to make decisions, there are too many interviewers, or they keep “moving the goal posts” on the requirements.
Note: Funny how business leaders’ perceptions change when you hold a mirror up to them that shows it’s the business that is putting the company at a competitive disadvantage by taking too long to make a hiring decision and not the recruiting team. 🙂
“If an organization aims to be best in class, it must first know where to set the target. — Jason Roberts, SVP Strategy & Standardization, Randstad Sourceright
The Requisition Productivity Roller-Coaster
As we have received more and more data in the last six months, what customers are starting to also see is how recruiter req workloads and benchmarked performance shift with the reality of how the world really works. As we all know, hiring is not a straight line and seeing the correlations of performance with the peaks and troughs in hiring and req work load is showing some very interesting insights for leaders.

What’s Next
“For talent acquisition to be viewed more strategic within the business, it has to become more data driven. The release of ERE’s Benchmarking solution is a much needed step forward for data driven recruiters to measure themselves against industry standards.” — Ivan Casanova, SVP Marketing. Jibe
At ERE’s recent conference in Vegas we released a free version of the tool for people to get a feel and view into overall medians for all Speed, Quality, and Productivity metrics. You don’t need to provide any data to get some interesting insights right now around overall benchmarked medians for all the metrics. Of course, if you want all of the cool features and insights, we are not going to give that away for free.
Access the free Benchmarking tool here
While we started off with 10 recruiting metrics, we are already in the process of expanding these based off feedback. I have been working with the Talent Board (The Cande Awards) to potentially include candidate satisfaction metrics in addition to creating cost, diversity, and candidate conversion metrics.
What is truly innovative is that in the near future we will be able to provide benchmarking against the keywords in job descriptions vs. relying on structured data, which is a time-intensive process of mapping job titles to a common taxonomy language. The potential of the power of this means you would not have to be worried about companies naming convention of job titles that map to your own which we all know can have lots of variations, but more importantly focus in on what skills (keywords) are needed to get the job done.
While this is version one of the product, we already have a great list of next-generation enhancements way beyond the value of what I could ever dream up. Greater dashboard customization, push notifications of quartile performance change, and more data visualizations to name a few.
I used to have a famous saying “Data for the sake of data is busywork.” I’m now thinking of revising it to: “Data for the sake of insights removes the busywork.”