
 Anyone who has ever read anything I’ve written about, or has heard me speak, knows that I love metrics. I’m a big proponent for using science to drive our outcomes. It has worked very well for our team, and we use data to drive continuous improvement. Our team is very high performing, so it is to their credit that they continue to improve and choose not to rest on their laurels.
In my role as director, and because of my experience with metrics, I deal with a lot of information and analysis. For my team, I’m obligated to keep it straight forward and to distill it down to the easy to digest. I need to remove obstacles, not create a data quagmire for my recruiters to navigate. We all have access to a myriad of dashboards, all of which are easy to read and comprehend (see the attachments here for examples), but it’s our walk-up boards that provide easy visual access to our key metrics, and do the most to drive results.
It’s often said “out of sight, out of mind,” that’s very true. We use our team boards to drive specific behaviors, and we change them up on a regular basis so that we are building up our recruiter skills. This is a low-cost, high-impact, easy-to-implement tool any recruiting leader can bring to bear to help drive results in their organization.
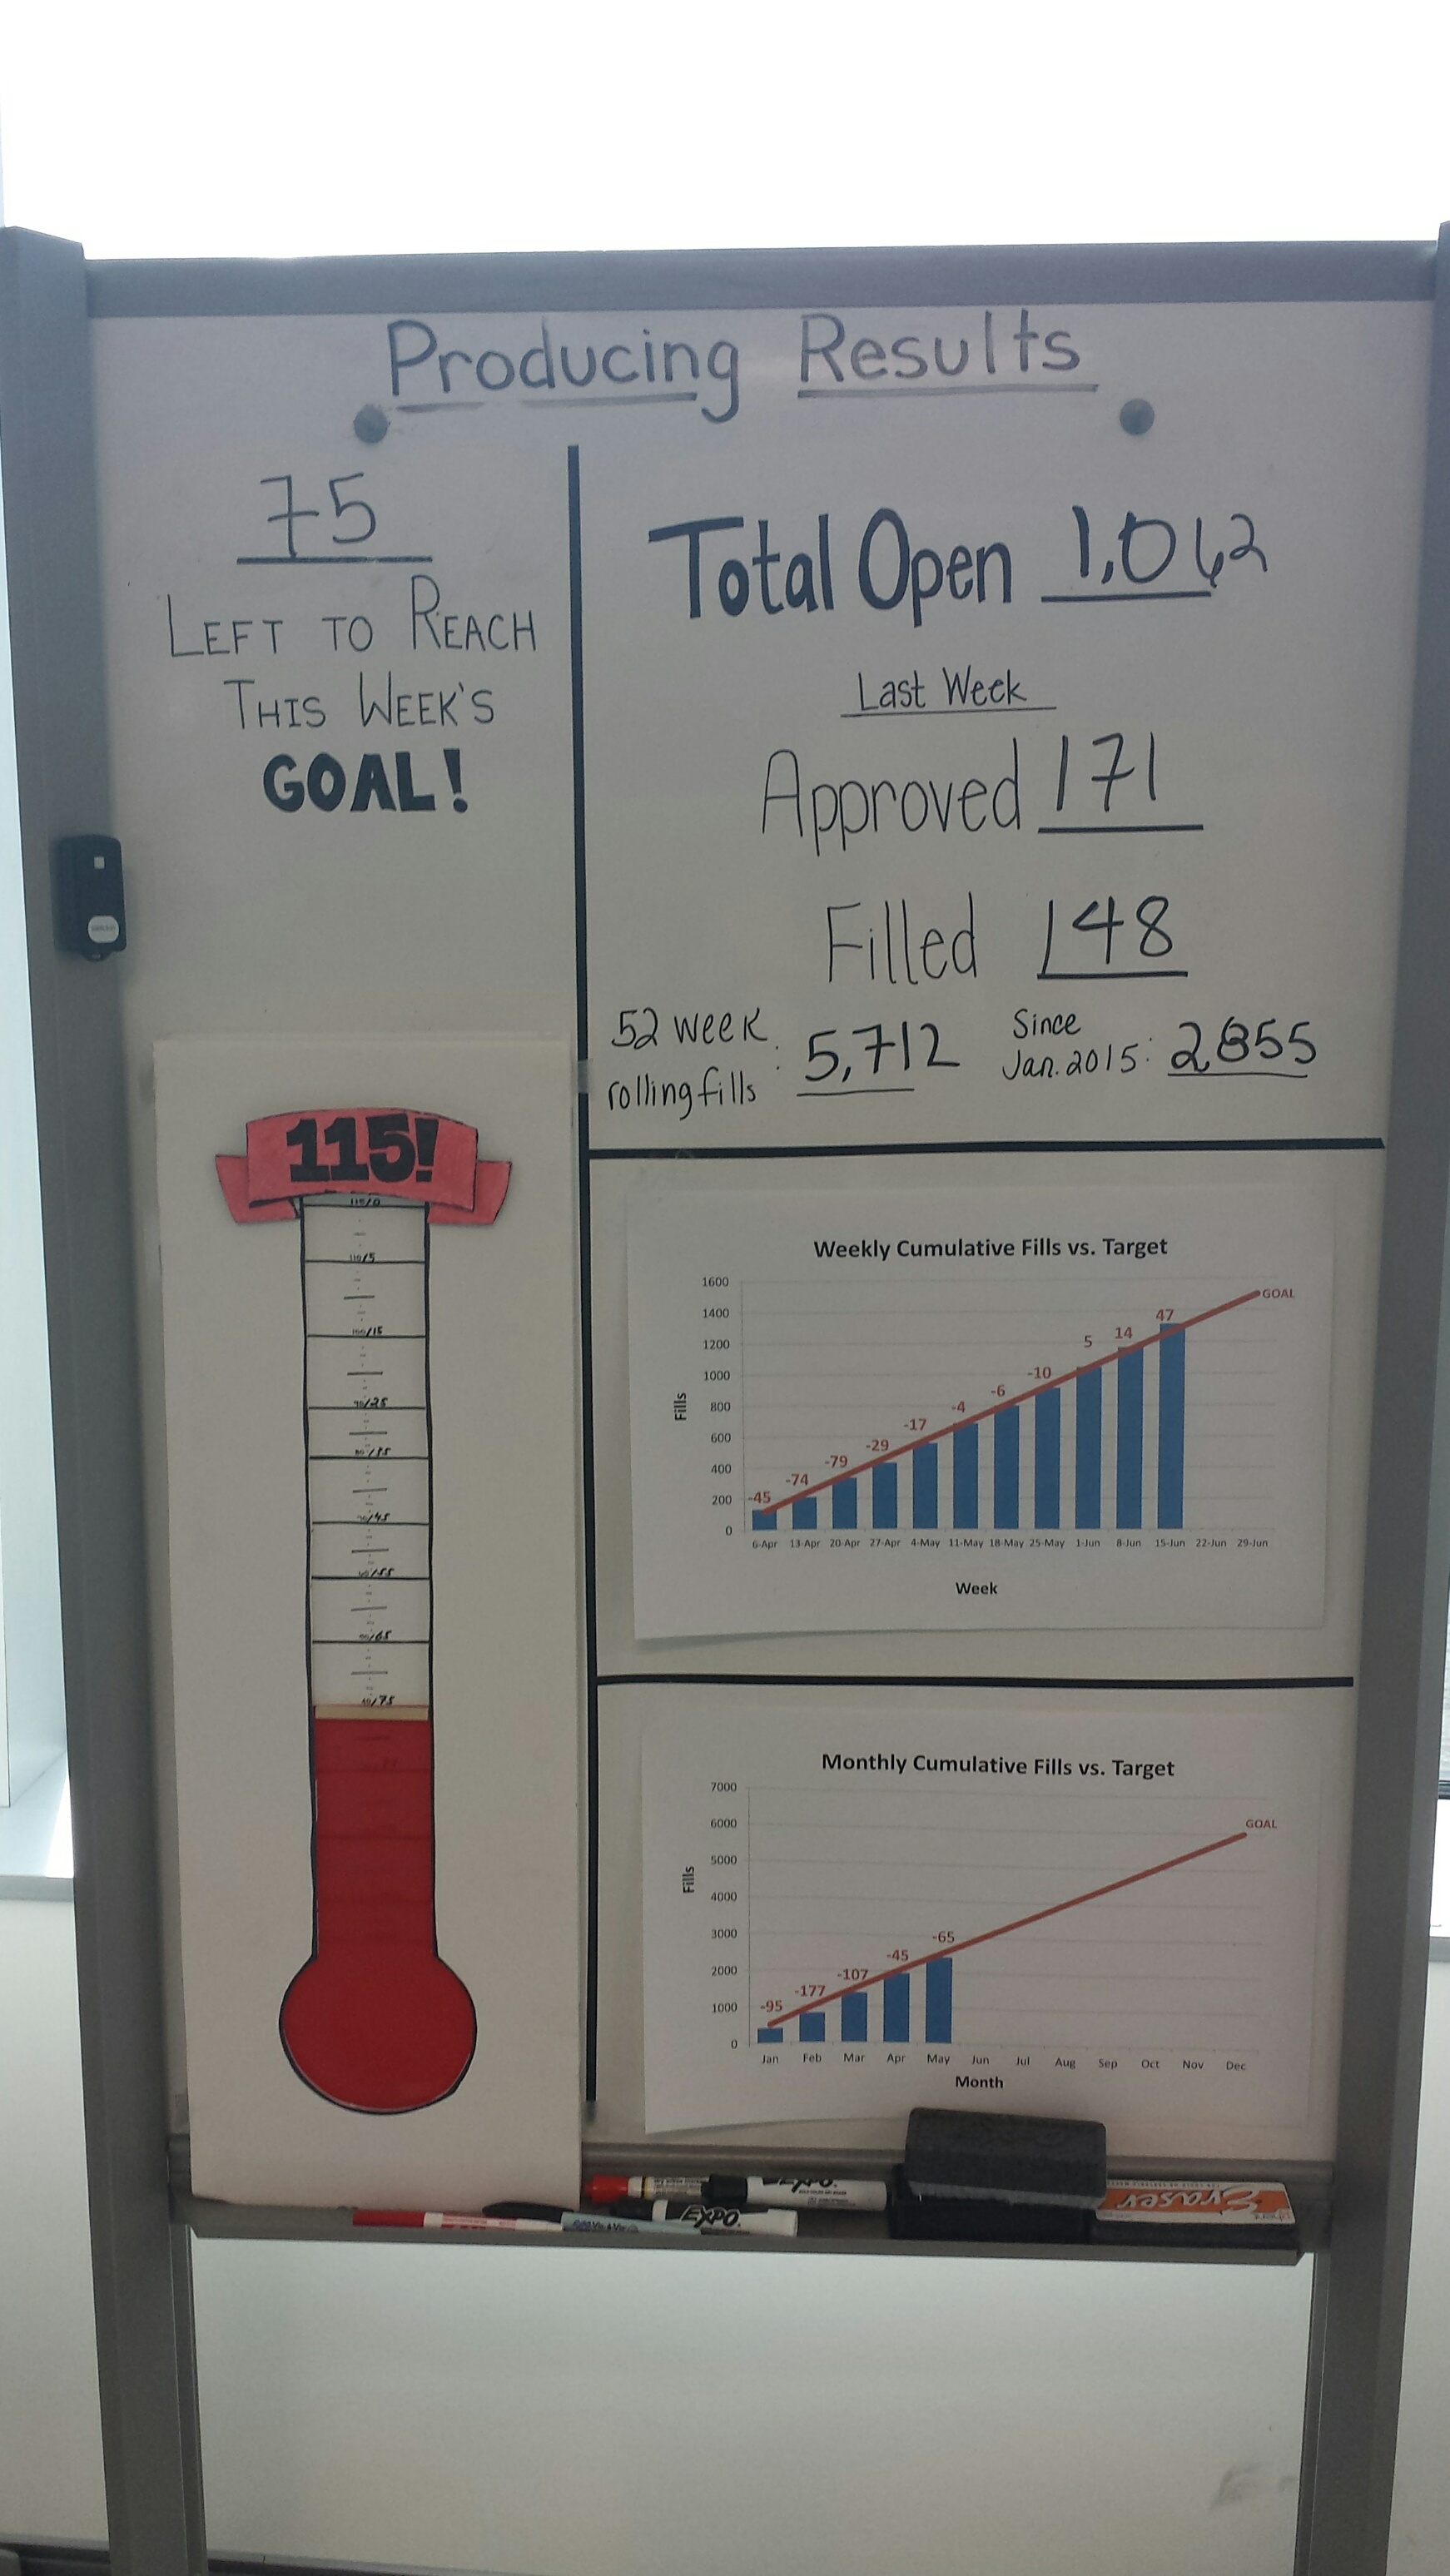
I’ve included a snapshot of one of our boards (we have four) that focuses on our weekly fill goals, and how it rolls up monthly and annually. This seems like such a no brainer to have in front of our team, but you know what? Our first boards didn’t include it. This was my fault.
We provide dashboards, and it’s easy to look back and see how many reqs are opened a year, and how many fills are required to meet that demand. What I didn’t realize was that no one was extrapolating that out, and then breaking it down into manageable chunks, and as such we had never clearly articulated what the required weekly goal number was. We all know that in recruiting, as in most work, it is far easier to break things down into sprints than to constantly try to run marathons. As a result, the team was not meeting their goal with regularity, and was falling short of the larger annual goal.
It became obvious that I and my managers needed to provide a clear explanation: 6,000 reqs opened a year/52 weeks = 115 fills a week on average. We then decided to move those numbers, literally, front and center where everyone could see them. We changed the results significantly.
Since adding it to our boards, the recruiters have exceeded their weekly goal almost every week, and not just by 1 or 2, but by 15 or more. Our fiscal year will be ending shortly and by that time the team will have increased already impressive fills last year by 5 percent this year! Additionally, because we use the boards to build behavior, they did this without compromising any of their other core metrics and measures.
As we look back, the white boards were inexpensive (and one of my more crafty recruiters made the cool goal thermometer), the time to maintain is minimal, but the results were massive and more than compensated for the costs. Again, this is quick and easy, and anyone can do it, as long as you keep it simple and report and discuss what really drives success.