If you need reasons to look to the nation’s 10.3 million under- and unemployed as a source of hire, the U.S. Bureau of Labor Statistics this week offered a few.
The government agency said job openings reached an all-time high in July, with almost 5.8 million vacancies at the end of the month. That’s an increase of a million open jobs over the count in July of 2014.
Private sector job openings accounted for 5.3 million of the total, more than a million openings more than the year before. (The numbers are seasonally adjusted.)
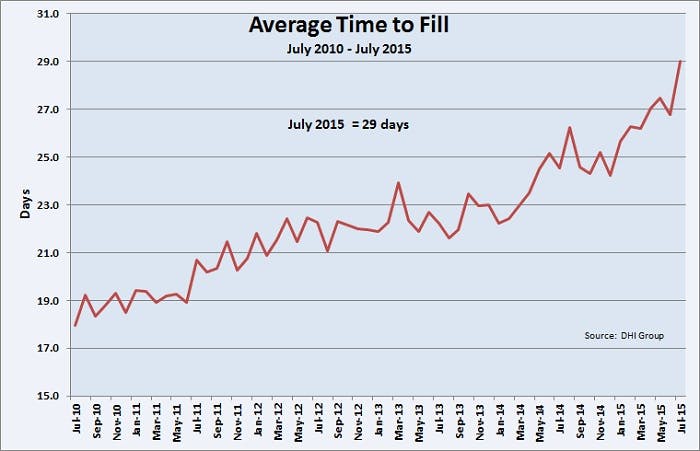
Another report, this one from niche career site publisher DHI Group, said the national average time it took to fill a job in July was 29 days. That’s four-and-a-half days more than a year ago, and two days more than in June.
It’s the longest average time to source and hire a candidate in the 15 years of the DHI-DFH Mean Vacancy Duration Measure, and nearly twice the time it took in July 2009, at the height of the recession.
Some jobs are harder to fill than others, according to the vacancy measure. At an average of 48 days, healthcare jobs take the longest to fill. Construction jobs fill in the shortest time – 11.9 days on average.
“Longer vacancy durations and falling unemployment rates point to a considerable tightening of labor markets in recent months,” said Dr. Steven Davis, an economics professor at the University of Chicago and co-creator of the measure. “Wage pressures are likely to intensify if the economy continues along this path.”
The rising number of openings, and improving consumer confidence, among other positive economic indicators have emboldened workers. They’re quitting their jobs in increasing numbers. The BLS, in its monthly JOLTS report, said 2.5 million private sector workers voluntarily quit their job in July. That equates to a rate of 2.1 percent of all private sector workers. And to an annual rate of about 26 percent, meaning that just over a quarter of the workforce, on average, will voluntarily quit this year.
Click chart for larger version
The BLS calculated the quits rate at 24.6 percent last year and 22.8 percent in 2013. (The BLS uses unadjusted numbers to calculate the annual rate.)
To put these numbers into perspective we need one more piece of information — the number of hires. The BLS says private employers made 4.6 million hires in July, the most recent month for which data is available. At the end of the month, then, the difference between open jobs and those filled was just over 800,000.
Although the BLS is counting mostly external hires (transfers from one site to another are included) and open jobs are those with active recruiting, attempting to mesh all the numbers is at best inexact. However, the broader picture is of an increasingly more difficult recruiting environment.
Adding to that picture is Tuesday’s release by The Conference Board of its Employment Trends Index. Heading up since bottoming out at 91.24 in July 2009, the Index was logged at 128.82 in August. That’s not far off its highest reading of 131.94 registered back in July 2000.
“The large increase in the Employment Trends Index in August suggests that a significant moderation in employment growth is unlikely to occur in the coming months,” said Gad Levanon, managing director of Macroeconomic and Labor Market Research at The Conference Board. “With solid job growth expected to continue, the unemployment rate is likely to go below 5 percent by year’s end.”
The Index is a particularly useful measure of employment trends. It aggregates eight labor indicators including the BLS’s job openings report, unemployment claims filings, temp hiring, and the Fed’s industrial production report.