![]() How good are the people who work for your company?
How good are the people who work for your company?
An honest, objective answer to that question would likely have you describing a statistical bell curve: Some top performers; a big middle, and a few at the bottom. As an HR professional, your performance management mission is to raise the overall quality of the workforce. Your yardstick for measuring success? The metrics of your top performers.
But how do you know your top performers are really top performers?
This is a question that professional sports scouts and college recruiters wrestle with all the time. A high school star might end up a bench warmer in college. A college standout might not make it out of training camp.
It’s now a question global assessment firm SHL is able to help businesses (at least) answer.
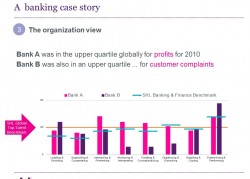
“We provide people intelligence,” says Caroline Paxman, chief customer officer. What that means is that SHL clients not only, now, can learn about the talents, behaviors, and skills of their own workforce, but can compare them to others in their industry, and get as granular as they like.
SHL’s Talent Analytics, as the newly minted product is branded, aggregates data from millions of assessments worldwide. Individual companies are not identified, but industries, job categories, and geographies are. That way, sales assistants of a retail company in the U.S. can be compared to all retail sales assistants, or to only other retail assistants in the same geography, or to whatever group the company thinks right.
 “There’s a gold mine of information,” Paxman says. “We’ve got millions and millions of data points from more than 25 million assessments we do every year.” Because SHL links the assessment results to business outcomes, “we’re demonstrating the business impacts of what we do,” she adds.
Here’s a simple example of what that means: Sales associates who score in the top quartile on SHL assessments cumulatively accounted for $120 million more in sales than those scoring less.
Now think what it would mean to compare the results of your in-house assessments to those of others in your industry? How do your top 25 percent compare to the top 25 percent among all SHL’s clients? It’s one way to know if your best is as good as you think.
That’s good information to have, but as Paxman points out, “rarely is benchmarking (done) for its own sake. It’s information to address a specific issue.”
SHL offers a case study from the utility industry. A new CEO with plans for change wanted to understand the talents and abilities of the leadership team and senior mangers and see how they compared to others. After extensive testing, the CEO found his team was superior in most areas to those at other utility companies and to senior managers generally. But he also discovered areas needing improvement.
SHL’s new Talent Analytics is pricey — $50,000 and up a year. And it’s of value to companies that have already conducted assessments, and know how their employees scored. For those companies, being able to compare yourself to the best in the industry — and to be able to see what skills, behaviors, traits, and the like the best share — can make the difference between being an industry leader and just another player.