
People, I am sure you have read enough posts about metrics that state “predictive analytics” is the pinnacle of the mountain we must aspire to as a profession.
Yes, forward-looking metrics that help you be more proactive vs. rear-view-mirror looking metrics that are more reactive are very important. In my experience, they are not as important as presenting your data, KPIs, and metrics, either to your own team or business leadership with the goal of showing how the metrics you are showing help save or make the company money.
In this article, I am going to give you some practical examples of what this looks like visually, and hopefully inspire you to rewire your own brain when thinking about recruiting-related metrics.
I have been reporting directly to the C-suite or talking directly with heads of business now for over a decade, and one truth is clear. If you want buy in on an investment, help with change in the middle layers of and organization, then you must present your ideas with a dollar lens associated with it.
I have been doing this so long now that when I speak with someone about anything to do with the attraction, assessment, or retention of talent, my brain automatically thinks in terms of how can I translate the situation back into dollars and cents.
Fixing the “Hiring Managers Want More Candidates Than They Need” Problem
Here is an example of historical challenge I faced where too many hiring managers in the company were in the mindset that they need to see more candidates on their open reqs than was actually necessary.
The top of the visual showed hiring managers in the company who partnered with recruiting only needing five candidates to be interviewed by the business (interview loop) on average to produce a hire (5:1). The bottom of the table shows the hiring-manager population that was at or above 20:1 in the number of candidates submitted by recruiting who they interviewed to produce that hire.
Take a moment to look at each aspect of the table (click to enlarge) to understand how I took a submittal-to-hire metric and then overlaid the associated time/dollars involved in producing different outcomes.
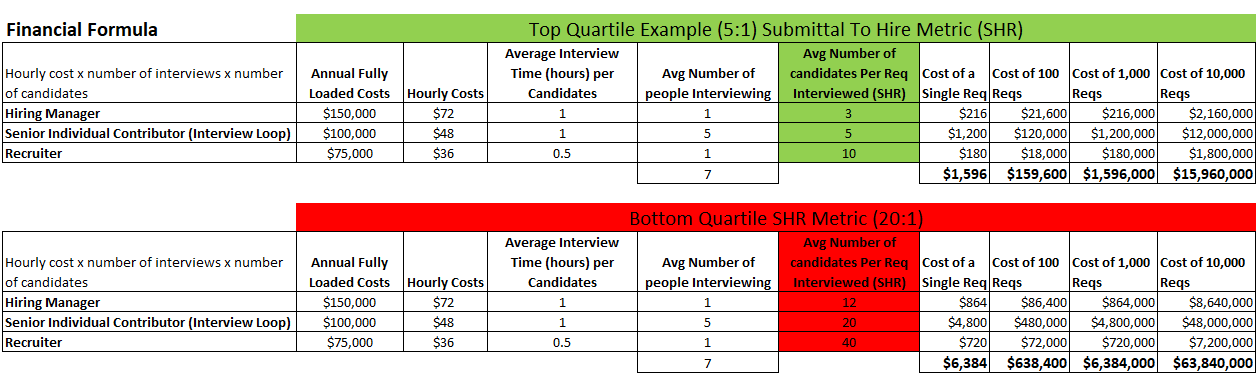
In this example, the company was handling hundreds of reqs a year, but I also wanted to show the impact in one visual of including thousands, and then explaining what the difference looks like if we applied a multiple-year lens to the problem.
I also wanted to raise awareness as to a recruiter’s time costs money as well, but I will get to that specific point in a second.
While most business leaders don’t get all hot and heavy about recruiters’ time, they certainly do when it comes where their business is spending time.
So back to recruiter time. When I showed this visual, I also spoke to the fact that the extra time we must spend on finding more candidates means a few things:
- Recruiters req loads decrease (can’t handle more)
- Time to fill increases (more candidates to be reviewed/screened)
- Hiring manager satisfaction gets impacted (why’s it taking to long to fill my req?)
- Quality of candidates can be impacted (Less time recruiters have to source/screen/assess)
What I found is when I presented the recruiter lens with the additional data points of sub-optimal outcomes, I could also overlay additional financials associated with the first table. Example:
What the cost of recruiting headcount looks like if we ran closer to 5:1 vs 20:1 on submittal-to hire metrics. As we all know, recruiting is a cost center, and recruiting headcount makes up the largest cost in a recruiting budget.
I am not suggesting that you always want to present the scenario about reducing heads. You can tell the same story but tie it back to the other bullet points above related to reducing time to fill, or improving quality of candidates submitted. I hope you get the point.
Back to the business, as its general about WIIFM.
Time the hiring manager/business spends interviewing is time not spent on building or fixing something in the business. It’s time away from producing revenue.
Lost Opportunity Costs a S@#$load in a Business
Here is another example I have used multiple times in my career to show the lost opportunity cost of roles that remain open. While I used sales roles in this example, because of the direct correlation to revenue generation, I have also found you can use formulas like Revenue Per Employee as a way to show the financial impact as well.
Take a moment to absorb the table below (click to enlarge). It shows how I presented this scenario to leadership in the past to get them to understand the impact that roles open longer than they needed had on the business.
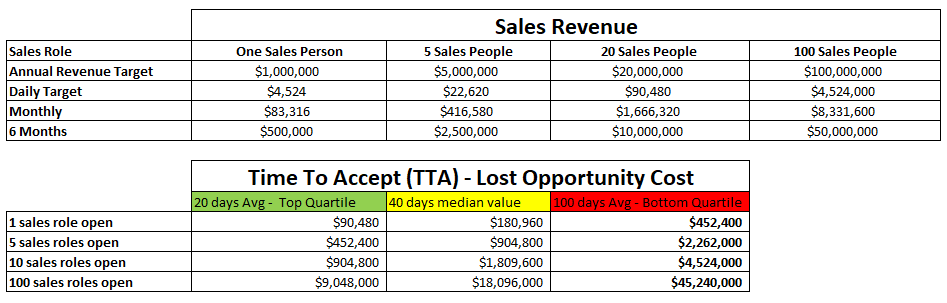
When leaders see recruiting data presented in financial terms, it’s like leading the witness. It did not take a room full of business executives long to reach for the calculator and quickly work out what even a five-day shift meant in dollars and cents.
Show Me the Money
Take a moment and discuss with your team or even your CFO about all the different ways you could present your metrics with a financial overlay. I have done these many times in the past with the metrics below and the financial impact they have directly on the business:
- Optimal req loads for my recruiting team.
- Impact of hiring managers taking too long to respond and give feedback on candidates (time in step/status).
- Impact of candidate retention within the first 12 months of employment.
- Financial impact of lack of a solid intake/kickoff call with recruiters and sourcers.
- Poor or a lack of structured interviewing to assess candidates.
- Correlation of sub-optimal offer acceptance percentages.
- Recruiters who have underperforming-candidate’s submission-to-business acceptance percentages.
- Req cancelation rates by the business.
- Time/cost of recruiters spending time on backfill reqs vs. net/new growth reqs.
A final thought I will leave you with:
The more I presented recruiting challenges/opportunities with a financial overlay, the more effective I became of translating conversations on the fly into dollars and cents. This helped me so many times in my career as business leaders got used to me translating how what recruiting was doing impacted saving or making the company money.
I reached a point where business leaders trusted my off-the-cuff commentary on even back of the napkin math vs. always having to go away and spend hours in Excel and then translating into a PowerPoint deck.
Like most things in life, the more you practice something, the better you get. I strongly encourage you next time you look at your own scorecards and KPIs, pause, and think of the financial overlay you can apply to tell the business story of how it saves or makes the company money.